
- Growing calls to sell BTC could fuel a rebound towards $68,600
- An important measurement revealed that the coin has not yet reached the peak of this cycle.
In an interesting turn of events, Bitcoin’s (BTC) fall below $63,400 has fueled a lot of fear, uncertainty, and doubt (FUD) in the market. This claim can be supported by looking at trader sentiment over the past 12 to 24 hours.
Using Santiment’s on-chain social tool, AMBCrypto noticed that the calls to sell were much more than the cries of “buy the dip.” A few weeks ago, that wasn’t the case. Indeed, any slight drop in the price of the cryptocurrency triggered a wave of bullish calls around this time.
Is fear the source of energy for a hike?
However, this situation is not entirely bad for Bitcoin, as a spike in FUD could trigger a rebound on the charts. In fact, something similar happened recently, specifically on April 21.
On that day, BTC depreciated and fell to $64,531, with many traders believing that further decline was imminent. However, contrary to these expectations, Bitcoin climbed and reached $67,169.
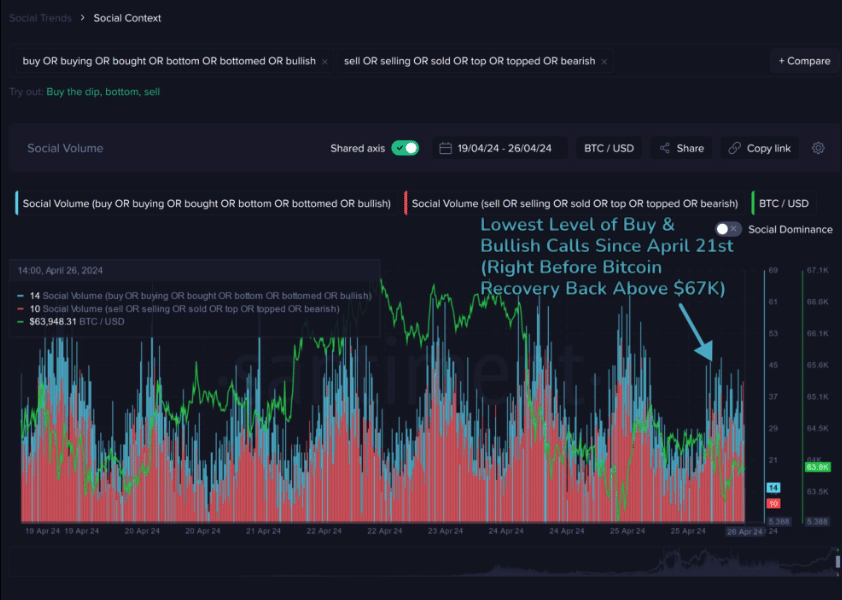
Source: Santiment
With this in place, it is possible to see a repeat of this situation if bears continue to publicly share their sentiment. However, it is also important to consider the possibilities of a metrics-based PoV.
To begin, AMBCrypto looked at the market value to realized value (MVRV) Z-score. For the uninitiated, the MVRV Z Score can spot the lows and highs of a cryptocurrency. It can also indicate whether an asset is overvalued or undervalued.
At the time of writing, Bitcoin’s MVRV Z score was 2.32. Looking at the chart below, we can see that since March, the price has rallied every time the metric fell below 2.60.
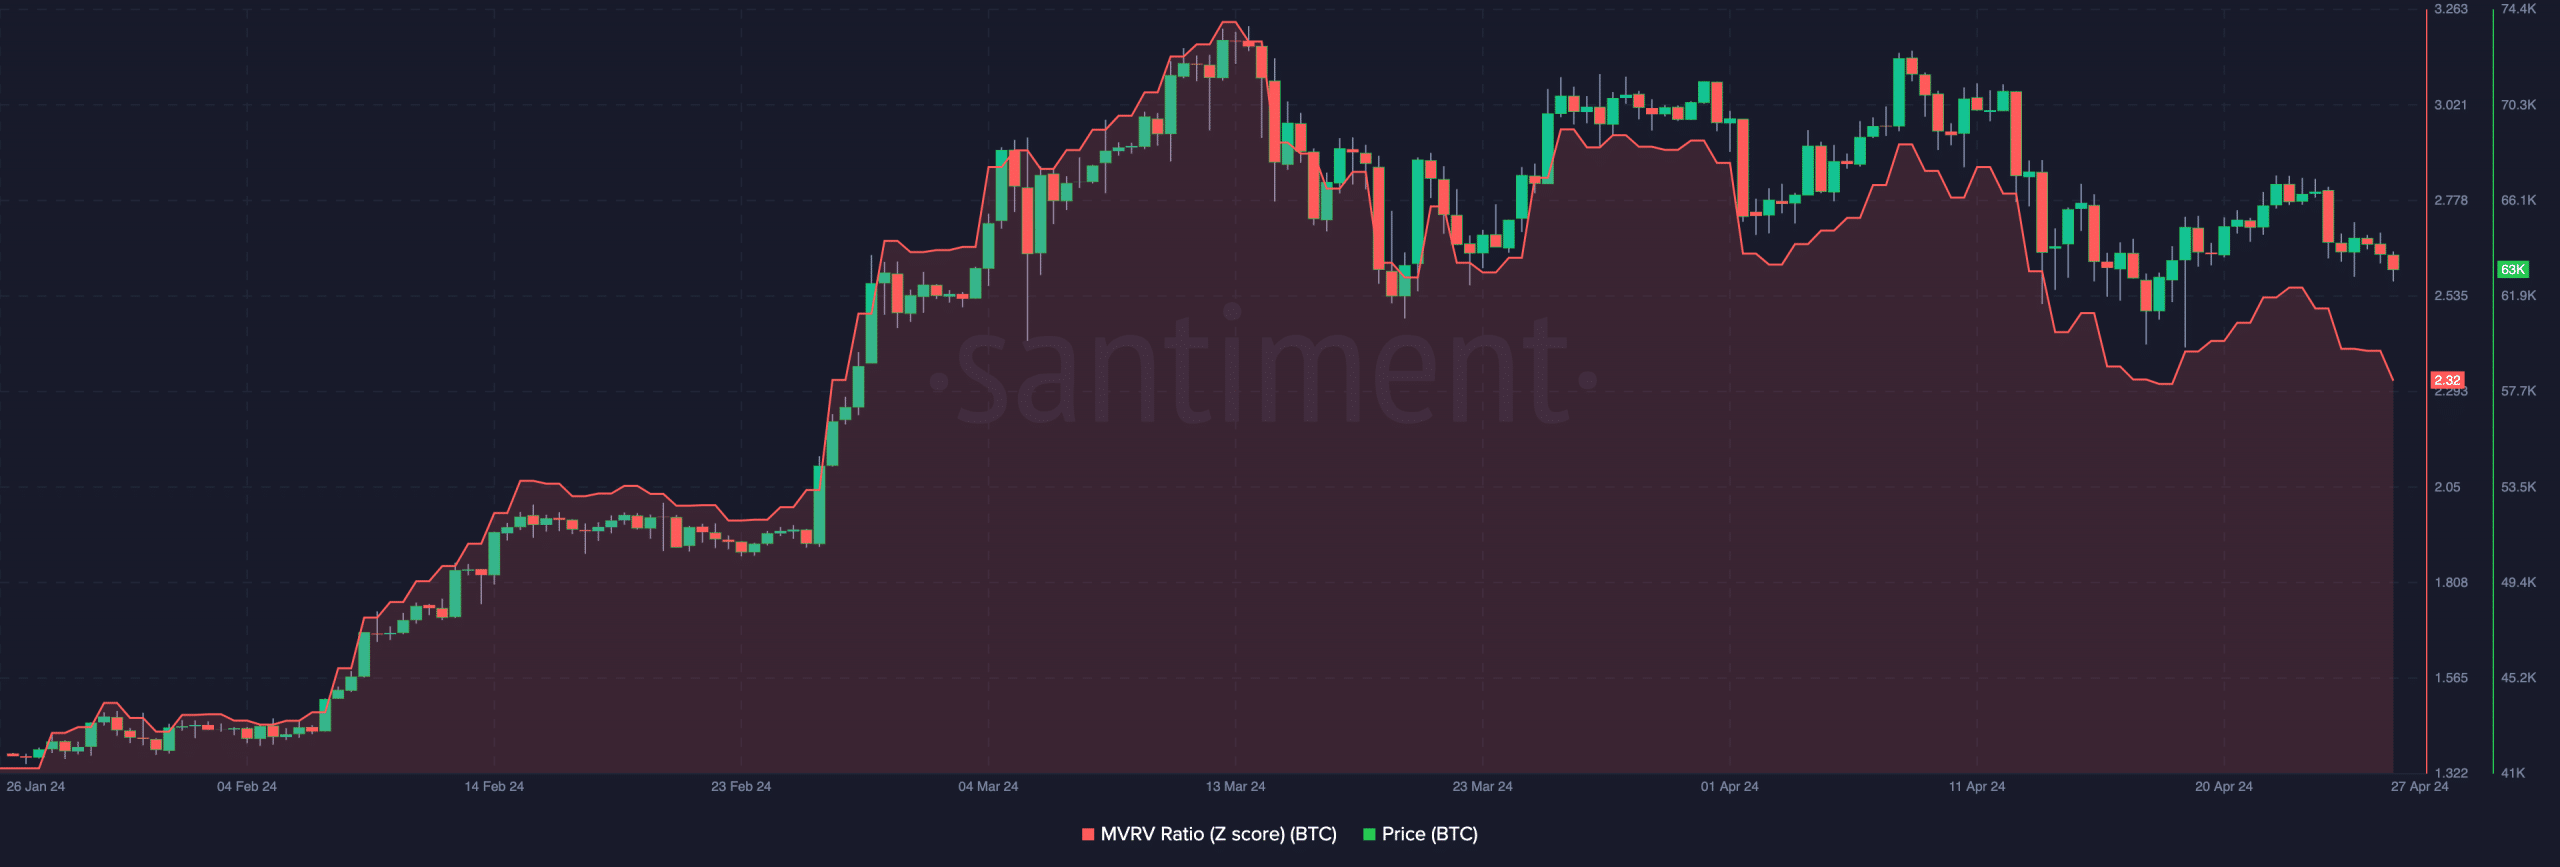
Source: Santiment
However, it is possible that BTC could fall below $62,400 if the bears maintain control over the price. If so, the recovery could be better and a rise to $68,600 could be the next step.
BTC looks strong for the latter part
Another metric assessed by AMBCrypto was the Pi Cycle Top indicator. Historically, this metric has been instrumental in identifying when BTC is overheating or otherwise. On the indicator, you will find two lines: a green one and a purple one. The green line represents the 111-day simple moving average (SMA), while the purple line shows the 350-day simple moving average (SMA).
In most cases, Bitcoin approaches the top when the 111SMA reaches the same place or exceeds the 350SMA. However, at press time, this was not the case as the green line remained below the purple line.
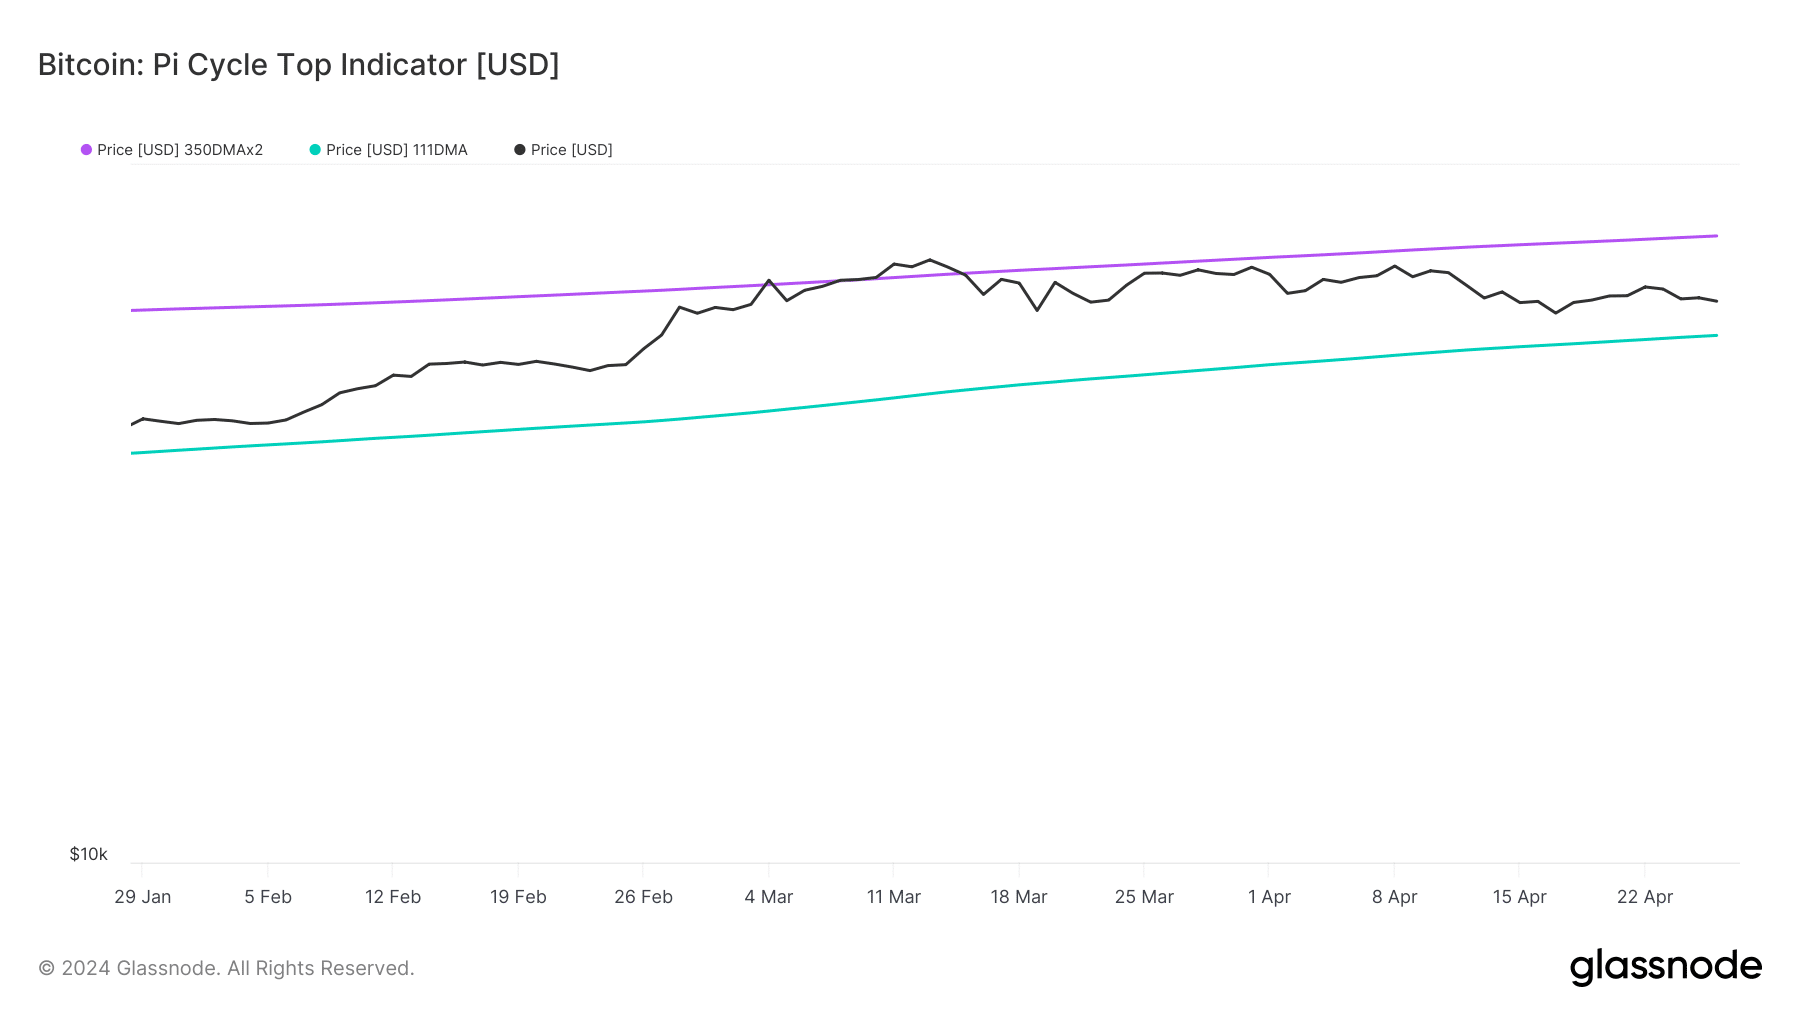
Source: Glassnode
Read Bitcoin (BTC) Price Prediction 2024-2025
The state of this metric looked great for Bitcoin bulls, not just in the short term. but for most of this cycle.
If the Pi Cycle Top maintains its position in the coming months, BTC could rebound. And a goal of $80,000 to $85,000 could also be possible.
News Source : ambcrypto.com
Gn bussni


 Cybertruck Recall Is Latest Setback to Stock’s Rough 2024")
